


Do you know if your website is working? If your social media content strategy is achieving its goals? If the recent changes you made to your tour booking page have resulted in more (or less) tour bookings?
Keeping abreast of analytics is a critical component of good digital strategy. In school marketing, analytics helps us:
- 1. Make decisions
- 2. Allocate resources
- 3. Track performance over time
In this guide, I’m going to step you through how the basic building blocks for understanding and integrating simple reporting principles into your regular marketing output. Let’s get started.
Start by understanding your digital ecosystem
Of course, before you start anything, make sure you understand your digital ecosystem super well. This might seem basic, but it’s a source of confusion and overwhelm that we regularly come across at Bolsta Digital.
Map out your platforms
In a document, write down a list of all your digital platforms that you school operates on.
Understand the goals of each platform
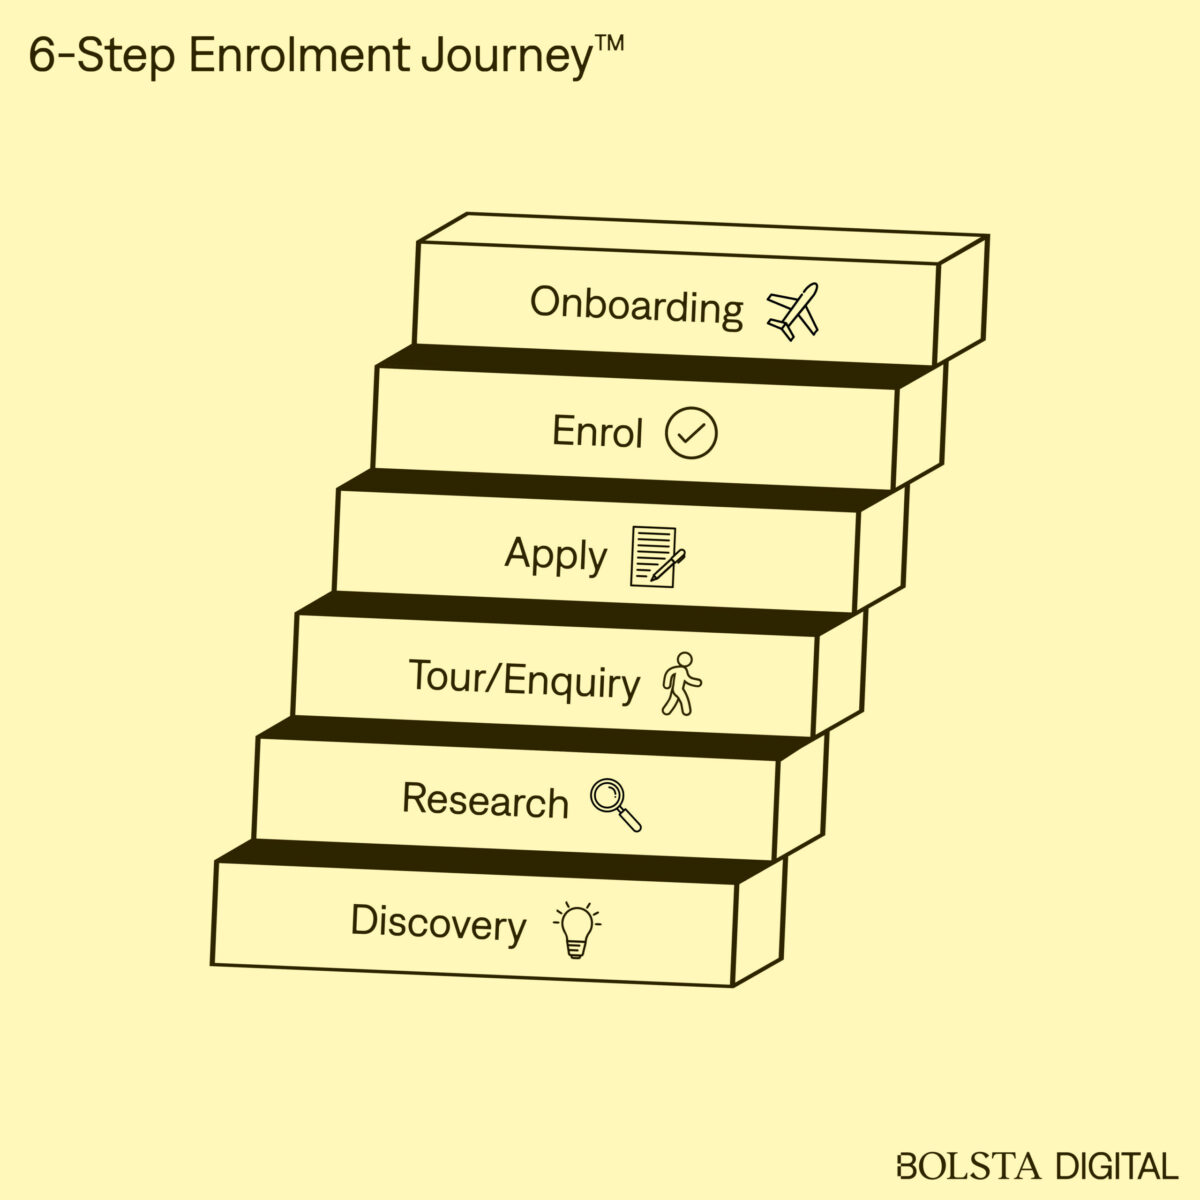
Next to each platform, write down the primary goal of each. Try to keep to two goals at a maximum. If you’re stuck on what your different platforms are trying to do, have a read through my Enrolment Journey thinking and use that as a guide (download the map as well, where I have specific goals listed for things like website and social media).
Bonus points if you can identify any specific points of conversion. I.e. A websites goal might be to get prospective parents to book a school tour. The specific conversion point is a form on the tour booking page.
The tools
Next, let’s take a look at what analytics tools are available to use, their purpose, and how you can get started on each.

Google Analytics
Fingers-crossed Google Analytics is already set up for your website. GA is an industry-standard tracking tool for understanding user behaviour on websites. If you could only set up one thing, it would be this. GA is very powerful and simple to install.
If you’re not sure whether GA is installed or not, you can put your website into SiteChecker.pro. If it is installed but you don’t have access, it’s time to do a little digging to see if you can track down the owner and ask for user permissions to be added.

Google Search Console
Google Search Console is a powerful platform that provides insights into how your website is performing in search results, helps identify and fix issues that may affect your site’s search visibility, and tracks important metrics like search queries, clicks, impressions, and ranking positions.
Getting started on Search Console is fairly straight forward – it just requires adding a record to your DNS, which your IT team should be able to action for you.

Microsoft Clarity
Microsoft Clarity is a free user behaviour analysis tool that provides insights into how users interact with your website through features like heatmaps, session recordings, and user engagement metrics. It’s similar to Google Analytics, but it’s actually more useful for certain uses, like understanding the experience of people’s engagement on your website. Clarity runs via a script on your website just like Google Analytics.

Meta Insights
Meta Insights helps track engagement, reach, and performance of your social media content and ads. It’s set up automatically, so it’s just a matter of accessing it through the Meta Business Suite.

Google Business
Google Business has metrics built into it to track it’s performance. It might be a smaller part of the mix, but it’s worth knowing that those metrics exist and can be drawn upon if needed.
Taking care of privacy
It’s important to mention privacy at this point. Laws are starting to change around the collection and storage of user data, and your responsibility as a school to both notify people, provide opt-out options, meet certain security standards for data storage, etc. In Europe, GDPR has been a trailblazing piece of legislation, and it will likely only be a matter of time before this comes into play in Australia.
I can’t offer tailored legal advice in this space, but what I can strongly suggest is speaking with your legal teams about this. They should be able to provide you with the advice and wording around Privacy Policies, storage/data collection, etc. Get your IT team in on this conversation, too.
Defining terms
Before we move on, let’s address some words you’ll come across as you get deeper into analytics.
- User: Unique individuals who visit your website during a specific period. Each user is counted once using cookies and/or IP addresses, regardless of how many times they visit the site during the period.
- View/impression: Raw amount of times a particularly page, site or post has been seen.
- Session: A session is a collection of user interactions with your website that take place within a given timeframe (usually 30 minutes).
- Acquisition/source: How someone has arrived at a particular destination (e.g. via a Google search or a link from another website)
- Bounce rate: The percentage of single-page sessions in which the user leaves the website from the landing page without interacting with it.
The metrics that matter
Now we’re really getting into it! Once you have your tracking platforms set up and you’re familiar with their general layout, it’s time to investigate some key metrics that help you understand how your digital ecosystem is performing.
Now, I could go through every metric available on Google Analytics, Microsoft Clarity or Meta Insights – but there’s plenty of resources out there for that if you’re so inclined.
What I want to focus on are the metrics that matter. Matter to what? Your enrolment journey. Everything. Always. Comes. Back. To. The. Enrolment. Journey.
Why? Because when the Enrolment Journey is humming, your prospective parents are having a great experience.
So what are the metrics that matter? Here’s where I would start:
Engagement rates
How are people engaging with your content? Google Analytics actually has an ‘engagement’ metric which triggers whenever somebody takes certain actions on your website. Viewing that as a percentage is particularly helpful.
Social media engagement is probably the most important metric to be aware of, but I think social media metrics are a little over-valued sometimes. Keep an eye on it, but be aware that things like including lots of photos in a gallery can artificially inflate engagement metrics.
- Benchmark: ~50%
Durations
How long is someone spending on your website? What about on specific pages? This is a great way to understand if people are engaging (reading) your content. If your shiny new article has an average session duration
- Benchmark: ~1:30
Conversions
The all important conversion. Conversions can take a bit of technical knowledge to set up properly in Google Analytics (but nothing a Google search won’t be able to teach you) – once they are set up, they are invaluable. Perhaps the most important metric to be consistently tracking.
- Benchmark: 3-5% on a tour booking page.
Heatmaps
If you have Microsoft Clarity set up, looking at heatmaps and scroll data is an incredibly useful tool for evaluating strong and weak parts of your website. Look at your key pages – what are people clicking on? Where are they dropping off? Use this information to help guide website updates.
How to interpret the data
All this work is somewhat futile if you don’t have a benchmark or guide for what the data actually means. Beyond the benchmarks I’ve listed in the previous section, here’s some more guidance:
Beware of vanity metrics
Vanity metrics are data points that may appear impressive on the surface but do not provide actionable insights or a true measure of business performance and success. They are often superficial and can be misleading, as they do not correlate directly with business outcomes or key performance indicators (KPIs) that drive growth. Vanity metrics can give a false sense of achievement and may distract from more meaningful metrics that offer deeper insights and facilitate decision-making.
Look for long-term trends and anomalies
Even if you’re not 100% sure if one data point in isolation is ‘good’ or not, watching that change over time can be illuminating. If a particular metric has been steady for 6 months, but then suddenly drops or rises, do you know why? It’s a yellow-flag that needs investigating.
Responding to changes
If you make an update to your website, can you see a corresponding movement in the data? In other words – can you validate your change?
Taking things to the next level
Once you have these foundational pieces covered, there’s a couple of ways to deepen your use of data:
Error reporting/exception reporting
Using data to spot errors or problems in your digital ecosystem is a great use-case. In particular, finding broken links (look for your ‘404 page not found’ in Google Analytics pages report), pages that aren’t indexed in Google Search correctly (using Search Console) and so on.
Segmentation
Segmentation is probably the most powerful way to add depth to your data, but it’s just too big to tackle fully in this guide. Segmentation is the process of dividing a broad user base into smaller groups of individuals who share common characteristics. For example, how do your website metrics change when segmented to only show mobile users? What about users who found your site through Google Search vs arriving directly? More on this in the future…
Creating automated dashboards
Once you are comfortable with a set of metrics that you use consistently, automated reports and dashboards are a great way to collate and present this data in a much quicker away. Using Looker Studio (formerly Google Data Studio) is the easiest way to start presenting data from Google Analytics and Google Search Console.
Finally, be kind to yourself
Data and analytics is overwhelming, even for people who are comfortable with numbers. Understanding how to make the data useful takes even longer. You’ve got this!
If you need a quick sense-check, check out our Enrolment Journey Health Assessment, which includes a small audit by our team on many of these key data points.
If you need help setting up the more technical aspects of analytics and reporting for the first time, we’re also happy to help. Simply reach out by booking a call.